新問題 13
A user has approached you about a virtual machine with the name infra-1 that is performing poorly on the vCenter Server vcsa0l a. In order to analyze the data offline, your team requires the esxtop data from the problem host with the following requirements:
* The esxtop data must be in CSV format
* The data must contain 20 iterations with a delay
Once captured, copy the results CSV file from the destination datastore on the host to the Desktop of the ControlCenter VM with the filename “esxiOlb-capture.csv’.
Note: WindSCP is installed on the Controller.
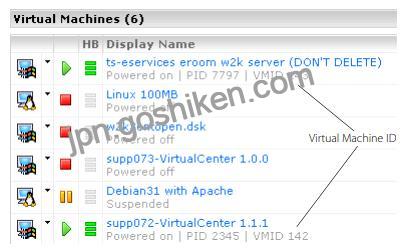
Do the following before you start to troubleshoot a problem using esxtop: 1. Log on to the VMware Management Interface for the ESX Server machine in question. Refer to the online document, Logging Into the VMware Management Interface, for details. In the status monitor, under Virtual Machines, note the virtual machine IDs (or VMIDs) for all virtual machines running on the server.

2. Make certain you have an secure shell (SSH) client. Windows users can get a free SSH client from http://www.chiark.greenend.org.uk/~sgtatham/putty/download.html. 3. If you have ESX Server version 2.0.x, refer to the VMware Knowledge Base Answer ID 1078 for instructions on downloading and installing the VMware performance monitoring tools, esxtop and vmkusage. ESX Server version 2.1 and higher include esxtop and vmkusage. See Using vmkusage to Isolate Performance Problems on page 6 for a description of vmkusage. Starting esxtop Perform the following steps to start and set up esxtop
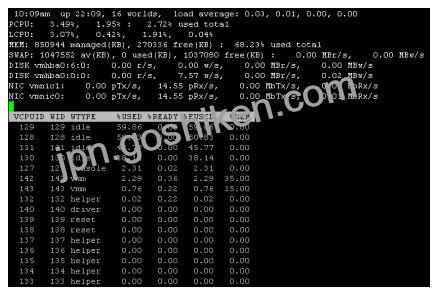
1. Using a secure shell (SSH), log on to the ESX Server machine as root. 2. Enter esxtop in the SSH command line. The esxtop display appears.

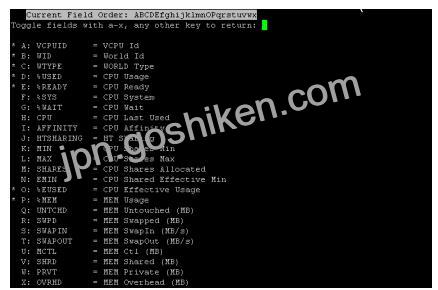
Note: The esxtop tool includes several interactive commands. To view a list of the interactive commands, enter h. 3. Enter the f command. The Field Select page appears

4. Enter r to toggle on the SWPD field.
5. Press any key other than a through x to see the esxtop display again

Note: You can also run esxtop in batch mode. For example, use the command: [root]# esxtop -b -n iterations > logfile. For detailed command reference information, enter man esxtop on the SSH command line. Examining CPU Usage This section describes how to assess system CPU loading, percentage of individual CPU use and individual virtual machine CPU use. Load Average Line Examine the load average on the first line to determine the amount of use for all physical CPUs on the ESX Server machine. The load averages are displayed for five-second, and one-, five- and fifteen-minute intervals. A load average of 1.00 means that the ESX Server machine’s physical CPUs are fully utilized, and a load average of 0.5 means they are half utilized. On the other hand, a load average of 2.00 means that you either need to increase the number of CPUs or decrease the number of virtual machines running on the ESX Server machine because the system as a whole is overloaded.
PCPU Line Examine the PCPU line for the percentage of individual physical CPU use for CPU0 and CPU1 respectively (for a dual-processor machine). The last value is the average percentage for all of the physical CPUs. As a rule of thumb, 80.00% is a desirable usage percentage, but bear in mind that different organizations have varying standards with respect to how close to capacity they run their servers. 90% should be considered a warning that the CPUs are approaching an overloaded condition.
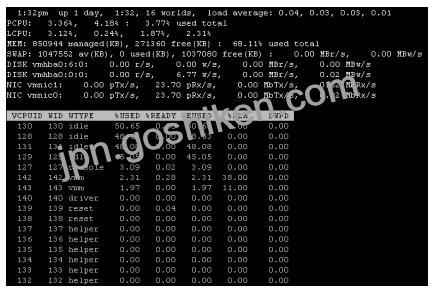
You can enter the interactive c command to toggle the display of the PCPU line. If hyperthreading is enabled, the LCPU line appears whenever the PCPU line is displayed. The LCPU line shows the logical CPU use. Virtual Machine CPU Usage A virtual machine world is listed as vmm in the WTYPE column. The world ID (WID) corresponds to the VMID in the VMware Management Interface Status Monitor (see Getting Started on page 2). For virtual machines with one virtual CPU (VCPU), the VCPUID and WID is the same. For virtual machines with two VCPUs, there are two VCPUIDs associated with one WID. For example:

Use the WID and VMID values as cross references to identify a specific virtual machine’s display name. Use the following steps to assess virtual machine CPU usage. 1. Examine the %READY field for the percentage of time that the virtual machine was ready but could not get scheduled to run on a physical CPU. Under normal operating conditions this value should remain under 5%. 2. Examine the %USED field for the percentage of physical CPU resources used by a VCPU. If the physical CPUs are running at full capacity, you can use %USED to identify a virtual machine that is using a large amount of physical CPU resources. 3. Examine the %EUSED field for the percentage of the maximum physical CPU resource usage a virtual machine is currently using. The %EUSED value is calculated as follows: %EUSED = %USED *((# of VCPUs * 100)/ max) In this formula: # of VCPUs is the number of VCPUs configured in a virtual machine. max is the maximum percentage of CPU resources allocated to a virtual machine. The default is 100. The following table shows how %EUSED increases as the value of max decreases for a virtual machine with a constant physical CPU usage of 40% (i.e., %USED = 40).

%EUSED is an useful indicator of how close a virtual machine is to saturating the physical CPUs. If a virtual machine consistently saturates the physical CPUs (i.e., it uses 100% of the physical CPU resources), you can fix it by either: * Decreasing the number of virtual machines running on an ESX Server machine.
* Moving the virtual machine to a different ESX Server machine that has more physical CPU resources, and increasing the value of max. Assessing Memory Usage Look at the percentage of maximum memory actively used by a virtual machine listed in the %MEM column. Also, note the amount of swapped memory used by a virtual machine listed the SWPD column. Using some swap space is not necessarily bad, because the pages swapped out could be inactive; however, the use of swap space is a clue that you could be losing performance due to active swapping. If the swap percentage increases, there could be a performance problem. If the maximum system memory or swap space is exceeded, additional virtual machines will not power up and you may need to reconfigure memory and swap space. Assessing Disk and Network Usage Examine the DISK and NIC lines for disk activity. If the throughput is either not meeting expectations or approaching the maximum capacity of the hardware device, there is a potential for a performance bottleneck. Exiting esxtop Enter q to exit esxtop
